Executive overview
See the major workstreams in one clear view.

An executive security operations concept connecting posture, incidents, risk registers, vendor risk and controls.
Executive cybersecurity dashboard · Public demo with example data
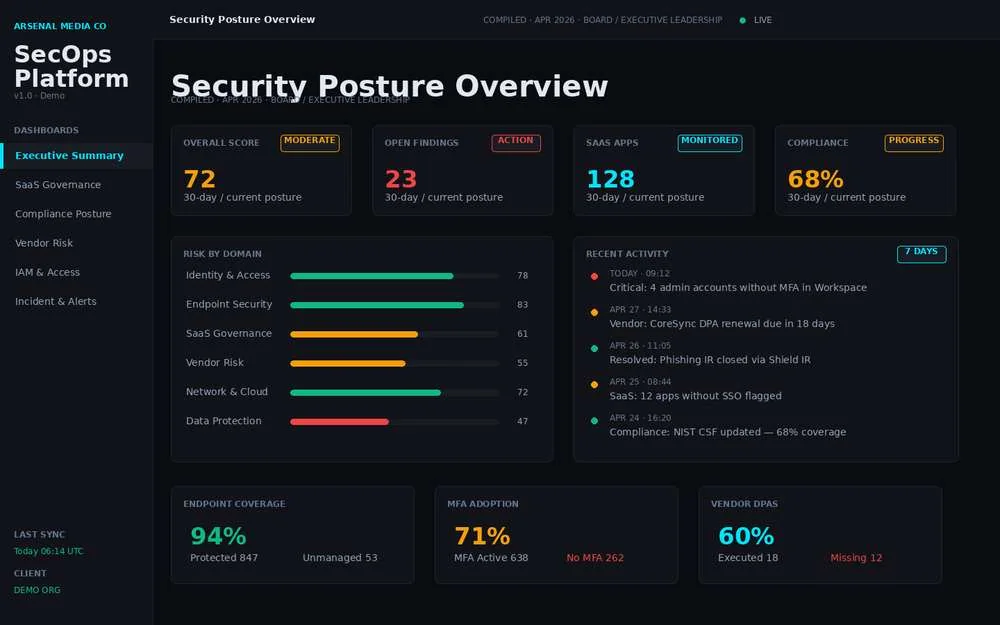
An executive security operations concept connecting posture, incidents, risk registers, vendor risk and controls.
Security leadership needs a clear way to see incidents, outstanding risks, controls and vendor exposure without assembling multiple disconnected reports.
An executive-level security dashboard concept with separate operational views for incident tracking, risk and compliance work.
See the major workstreams in one clear view.
Track incidents and risk register items consistently.
Keep the status of governance activities visible.
These are actual Arsenal Media screenshots and project assets, shown without cropping the interface.
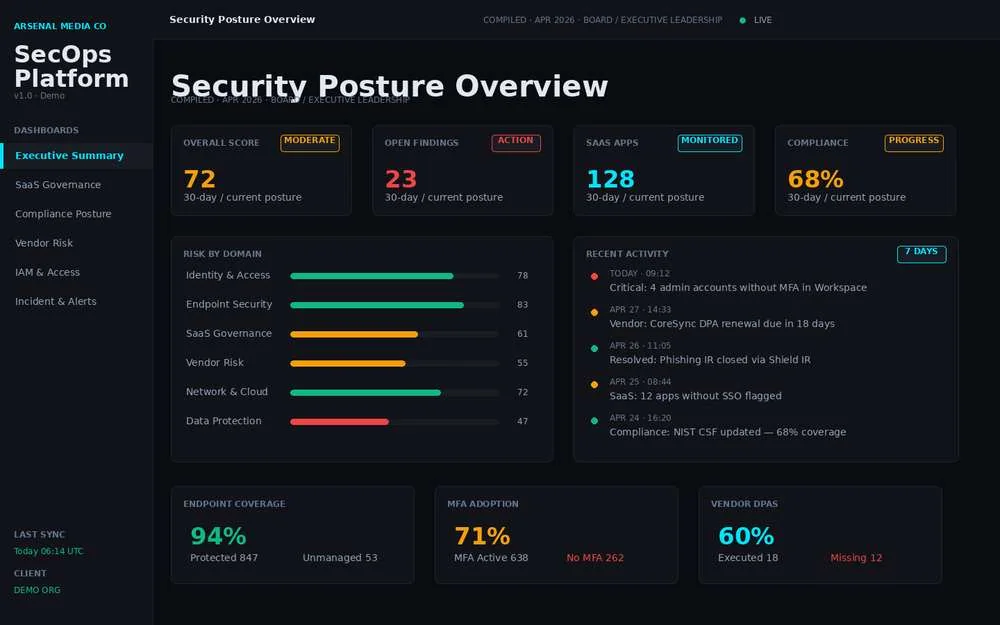
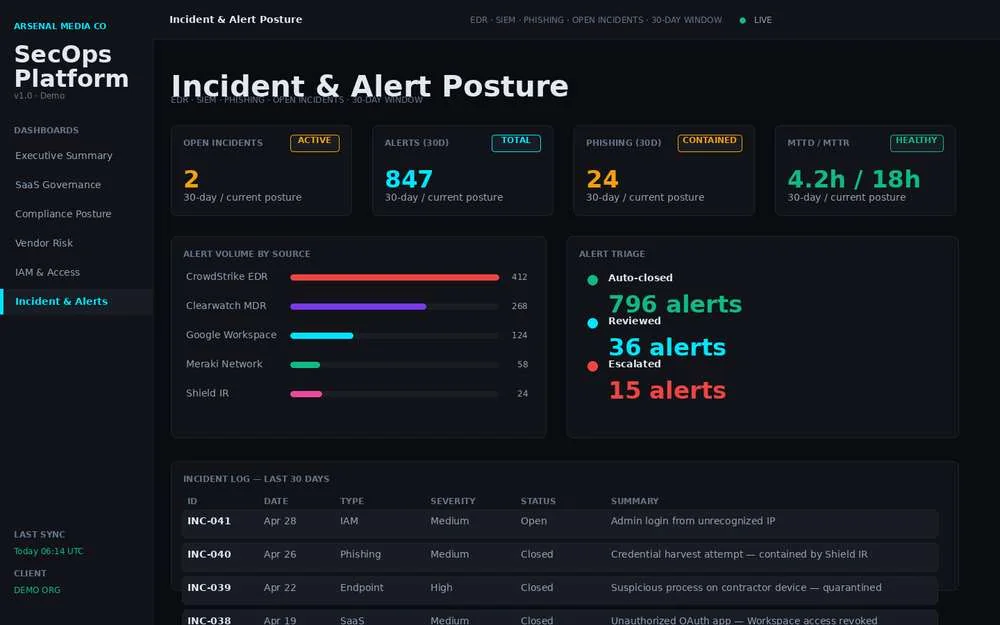
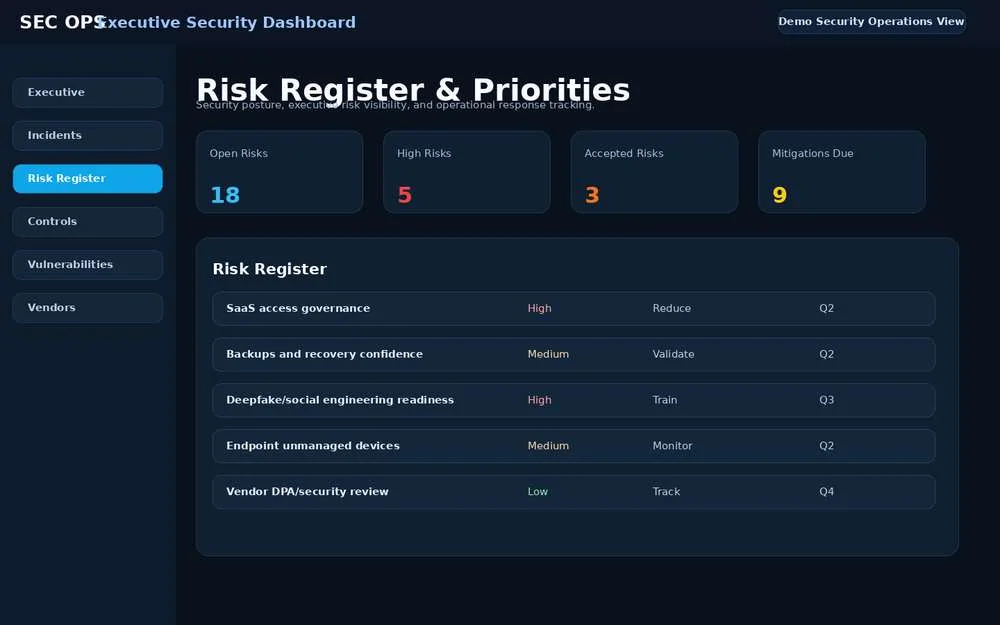
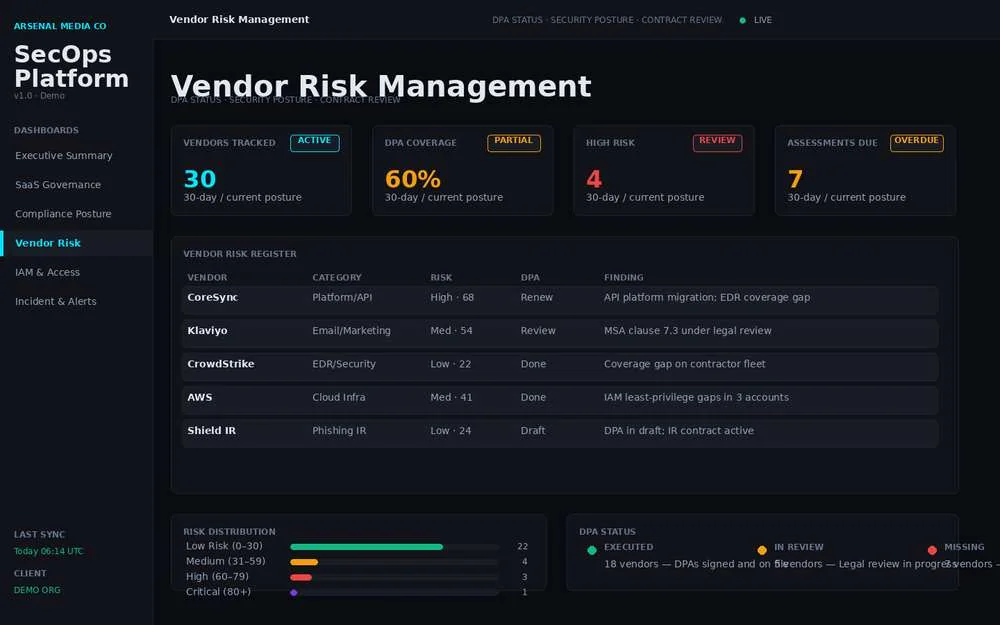
An executive-level security dashboard concept with separate operational views for incident tracking, risk and compliance work.
Start with what you need to improve, not a long technical specification.